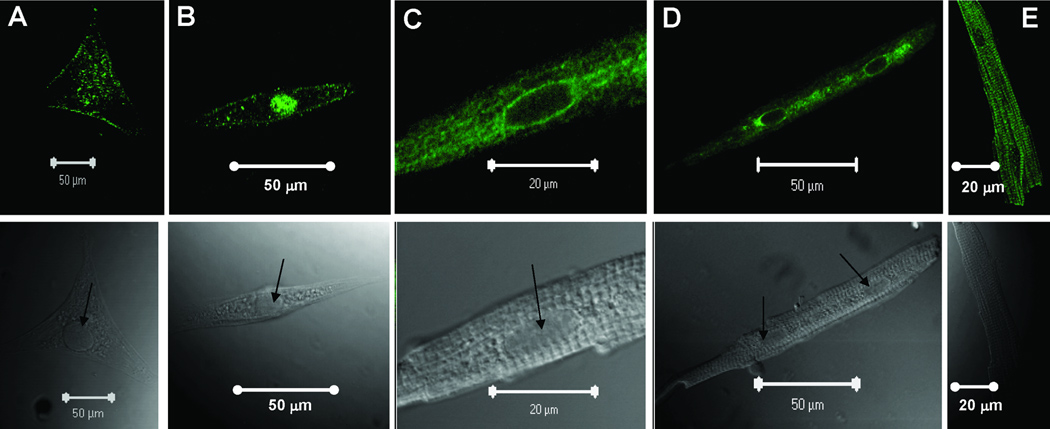
Figure 2.
Representative confocal images of isolated atrial myocytes using anti-α1D Ca2+ channel antibody. Upper panels show the staining pattern of the α1D Ca2+ channel protein using FITC-labeled secondary antibody. The lower panels show the phase controls of the cells at different developmental stages. A: fetal, B: neonatal, C: 6-weeks (amplified from panel D), D: 6-weeks, E: 6-months. Arrows indicate the nucleus.

