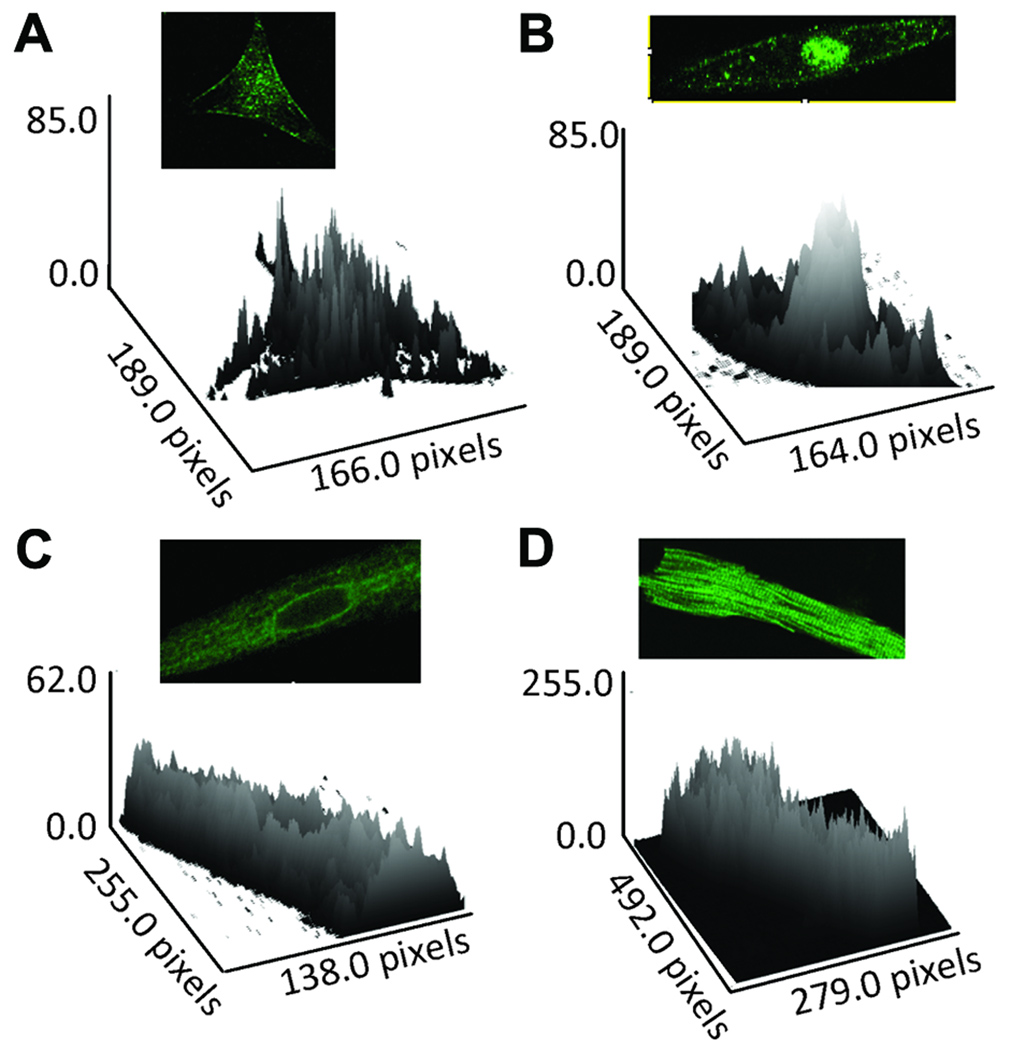
Figure 5.
Surface plots corresponding to Figure 2 showing staining intensity of the α1D protein across the atrial cells including sarcolemma and nucleus at different developmental stages. A: fetal, B: neonatal, C: 6-weeks, D: 6-weeks, E: 6-months. Note prominent nuclear staining at both fetal and neonatal stages compared with adult stages. Note that nuclear staining is more prominent that sarcolemmal staining in the fetal and neonatal atria (panels A and B) compared to 6 weeks and 6 months old atria (panels D and E).

