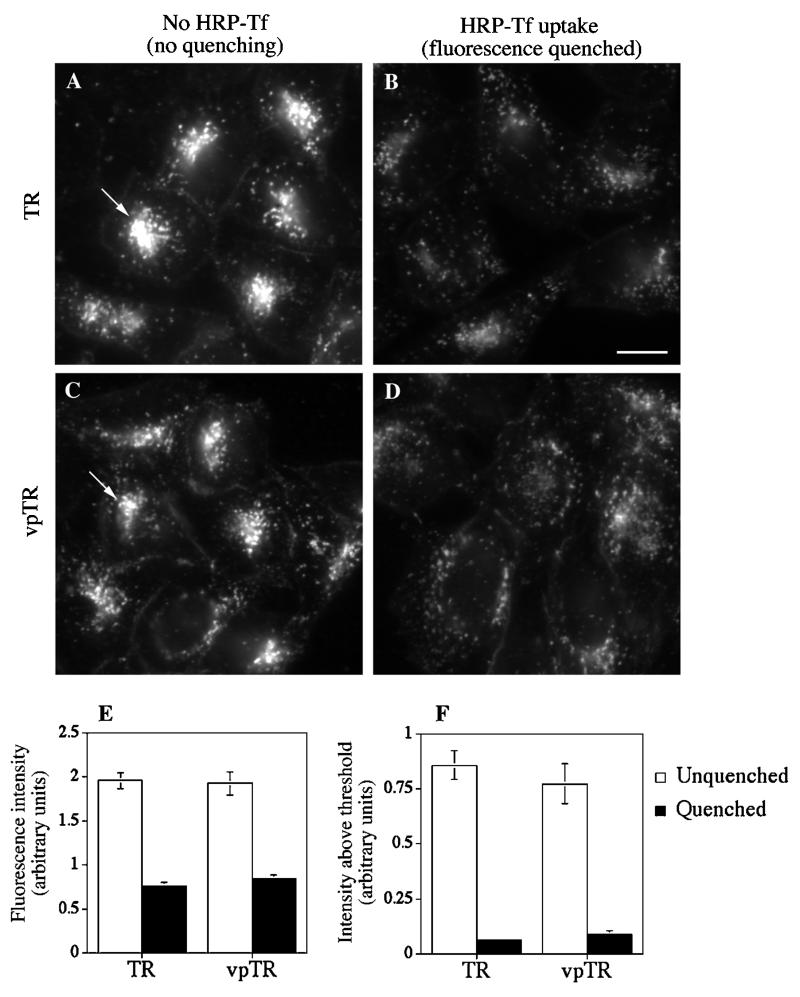
Figure 10.
Colocalization of the TR or vpTR with F-WGA shown by fluorescence quenching. Cells were labeled with F-WGA, incubated with either HRP-Tf or unlabeled Tf, and processed for DAB cytochemistry to quench the F-WGA fluorescence as described in MATERIALS AND METHODS. (A–D) F-WGA fluorescence with no HRP and no quenching (A and C) or after quenching due to HRP-Tf uptake (B and D) in cells expressing the TR (A and B) or vpTR (C and D). Arrows, recycling compartments labeled with F-WGA. Scale bar, 10 μm. (E) Total fluorescence intensity per field in cells with or without HRP-Tf uptake (mean ± SE, N = 10 fields, >20 cells per field). (F) Fluorescence intensity per field above a threshold in cells with or without HRP-Tf uptake. The threshold was chosen to include the recycling compartments but exclude peripheral fluorescence (explained in MATERIALS AND METHODS).

