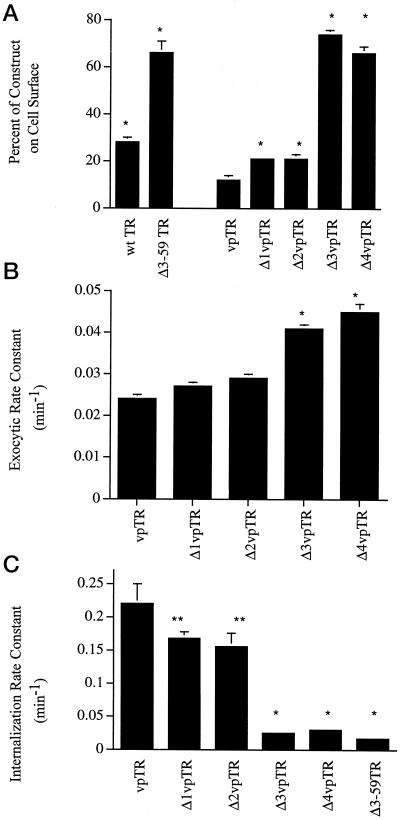
Figure 2.
Endocytic trafficking kinetics of the amino-terminal deletion vpTR constructs. (A) Percentage of vpTR deletion constructs on the cell surface at steady state. The results shown are the average values ± SEM from at least three independent determinations. (B) The average recycling rate constants from at least four independent determinations ± SEM are presented. (C) The average internalization rate constants from at least four independent determinations ± SEM are shown. The data are from representative clonal lines expressing the various constructs. The values noted by an asterisk are different from the corresponding value for vpTR with P values < 0.001 (heteroscedastic, two-tailed Student's t test). The internalization rate constants of Δ1 and Δ2vpTR differ from the internalization rate constant of vpTR with a P < 0.1, noted by a double asterisk (heteroscedastic, two-tailed Student's t test).

