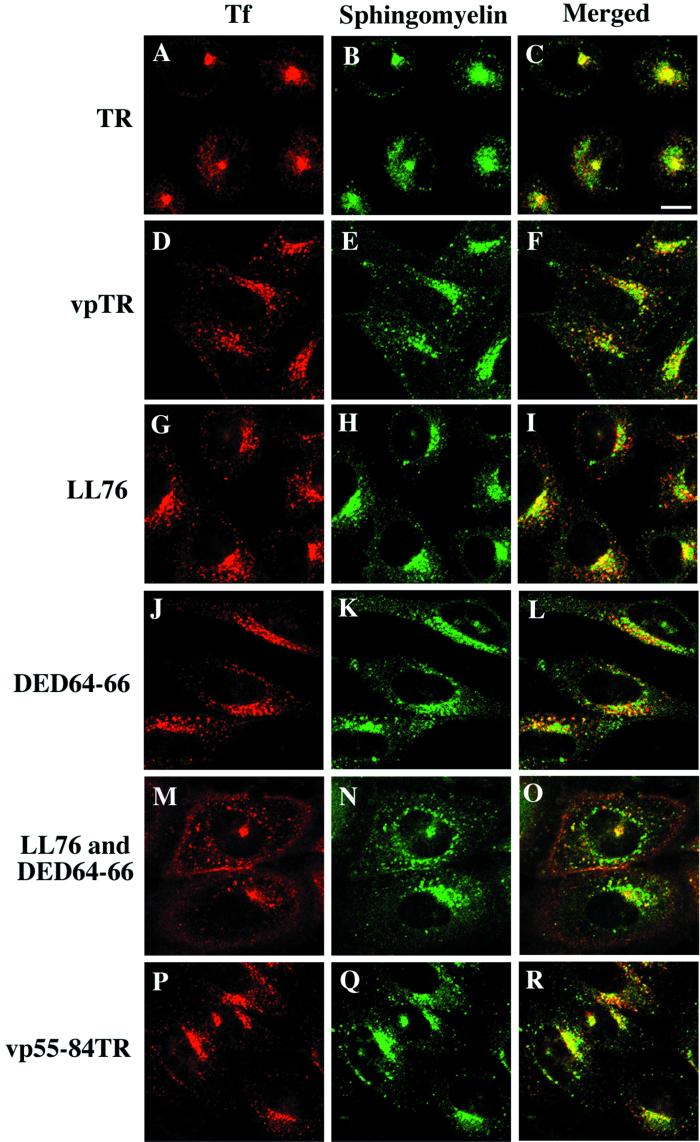
Figure 9.
Colocalization of NBD-SM and Cy3-Tf. Uptake of NBD-SM (green) and Cy3-Tf (red) is shown in cells expressing the TR (A–C), vpTR (D–F), LL76,77AA mutant (G–I), DED64–66AAA mutant (J–L), LL76,77AA and DED64–66AAA double mutant (M–O), or vp55–84TR (P–R) constructs. Scale bar, 10 μm. Images are single optical sections (1-μm thickness) from the confocal microscope.

