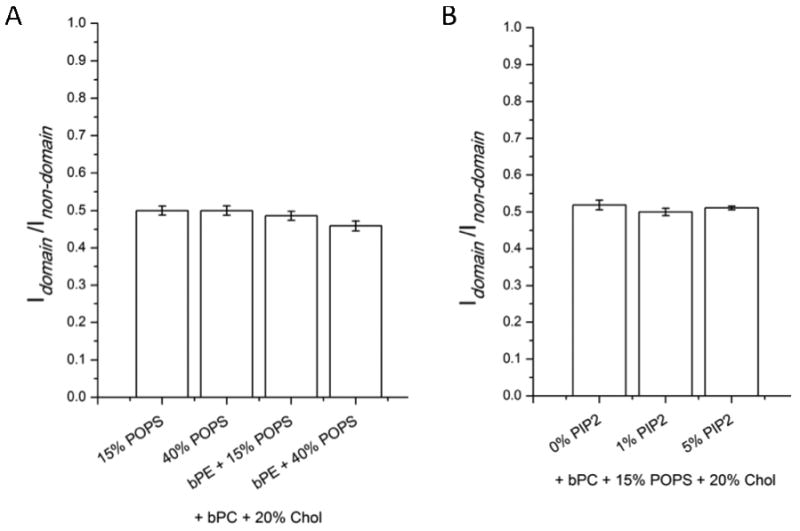
FIGURE 3.

Synaptotagmin I C2AB fluorescence intensity ratios of ordered lipid domain regions over disordered lipid non-domain regions after binding to asymmetric two-phase bilayers in the absence of Ca2+ (1 mM EGTA). The lipid compositions of the inner leaflet monolayers are as labeled on the x-axis. All outer leaflet monolayers are composed of bPC/bSM (1:1) plus 20% cholesterol and supported on a polymer cushion. (A) Binding and fluorescence ratios to inner leaflet monolayer with different concentrations of PS and PE. bPC/bPE is 1:1 when bPE is present. (B) Binding and fluorescence ratios to inner leaflet monolayer with different concentrations of PIP2 in the presence of 15% PS. Error bars indicate standard errors.
