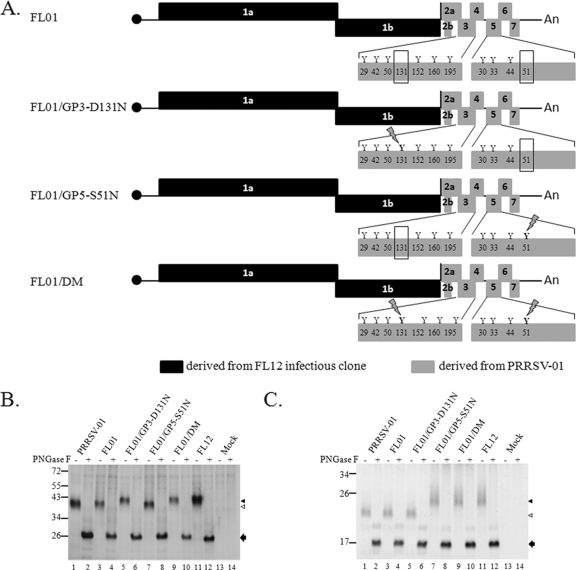
Fig. 3.
(A) Schematic representations of the genomes of chimeric virus FL01 and mutants derived from it. The letter “Y” and the numbers below them represent potential N-glycosylation sites and their relative positions on the corresponding proteins. The absence of N-glycosylation sites at position 131 in GP3 and position 51 in GP5 is highlighted by rectangular boxes. N-glycosylation sites that are artificially reintroduced to the genome are shown with a lightning bolt symbol over the site. (B and C) Electrophoretic mobility of GP3 and GP5, respectively. MARC-145 cells were mock infected or infected with the indicated virus. At 36 h postinfection, proteins were radiolabeled as described in Materials and Methods and immunoprecipitated with anti-GP3 antibodies (B) or anti-GP5 antibodies (C). The immunoprecipitated proteins were left untreated (−) or were treated with PNGase F (+) and analyzed by electrophoresis on SDS-polyacrylamide gel. The approximate molecular masses (in kilodaltons) of the marker proteins are identified to the left of the gel. The positions of fully glycosylated proteins (black triangles) and of the protein species lacking one N-glycosylation site (white triangles) are shown to the right of the gel. Protein bands indentified by black arrows are the products of PNGase F digestion.

