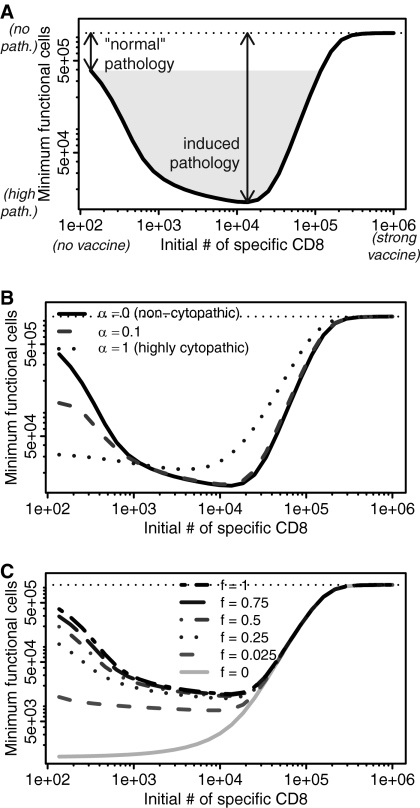
Fig. 2.
Pathology is maximum for intermediate initial numbers of virus-specific CD8 T cells. The lower the minimum number of functional host target cells (U + fV) was at any point during infection, the greater the pathology. The number of host target cells in the absence of infection is shown by the horizontal dotted line. (A) An intermediate response to vaccination can induce pathology beyond that experienced by an unvaccinated individual. (B) Noncytopathic viruses (α = 0, solid line) in particular show greatly increased pathology. As we increase the cytopathicity of the virus (α), the pathology at low numbers of CD8 cells becomes more similar to the pathology at intermediate numbers of CD8 T cells. (C) This effect holds as long as infected cells retain some degree of functionality, f (f > 0). For all panels, other parameters are the same as described for Fig. 1B.

