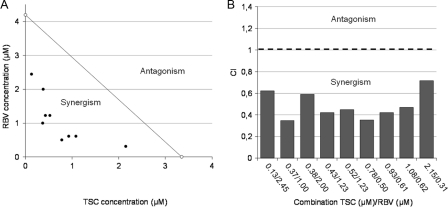
Fig. 11.
Isobologram analysis and CI. (A) Isobologram analysis. Individual TSC and RBV EC50s were plotted on the x and y axes, respectively (white circles). The diagonal line that intercepts these points is defined as the additive isobole. Each full circle on the plot represents each experimental drug combination that produced the same antiviral effect (50% inhibition of viral CPE). Synergism or antagonism is indicated when experimental combinations fall on the lower left or on the upper right of this isobole, respectively. (B) The CI was calculated for each experimental combination that led to a 50% inhibition of viral replication (see Materials and Methods). A CI value equal, below, or above 1 represents additive interaction, synergism, or antagonism, respectively.

