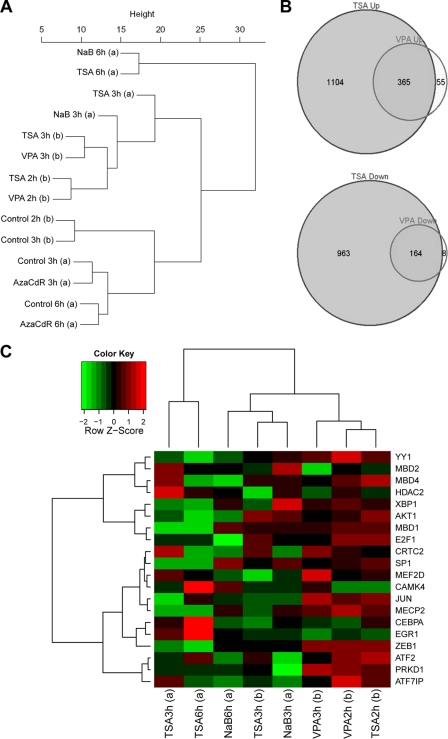
Fig. 9.
Comparison of cellular gene expression in HH514-16 cells after treatment with TSA, NaB, VPA, or AzaCdR. (A) Hierarchical clustering analysis of data from two gene expression microarray experiments. In experiment a, total RNA was extracted from HH514-16 cells harvested 3 or 6 h following no treatment or treatment with NaB, TSA, or AzaCdR. In experiment b, total RNA was extracted from HH514-16 cells harvested 2 or 3 h following no treatment or treatment with TSA or VPA. The data analysis was derived from 13,851 variable genes with standard deviation/mean ratios of >0.1. (B) Venn diagrams of microarray data comparing effects of TSA and VPA on cellular gene expression after 3 h of treatment relative to expression in untreated cells. (C) Heat map comparing the expression of 20 genes implicated in the EBV latent-to-lytic switch in the two gene expression microarray experiments. The heat map function shows Z scores, calculated by the equation Z = (x − μ)/σ where x is a raw score to be standardized, μ is the mean of the population, and σ is the standard deviation of the population.

