Fig. 1.
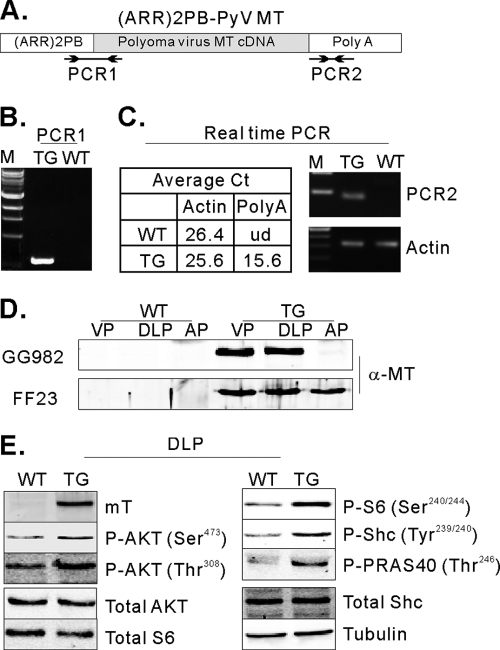
Expression of functional polyomavirus middle T in the mouse prostate. (A) Schematic diagram of the DNA construct used for the creation of transgenic mice. PCR1 represents the expected PCR product from genomic DNA for genotyping. PCR2 represents the PCR product of real-time PCR for measuring expression levels. Arrows indicate oligonucleotides used for PCRs. (B) An example of a genotyping PCR. TG, transgenic mouse, WT, wild type. (C) The table summarizes the average real-time cycle threshold (Ct) values. ud, undetected. The real-time PCR products were run on an agarose gel. (D) Detection of MT expression in the mouse prostate. Cellular lysates were prepared from the anterior (AP), ventral (VP), and dorsal/lateral prostate (DLP) from 10-week-old TG (GG982) and WT littermates and 30-week-old TG (FF23) and WT littermates. Transgene expression was confirmed by immunoblotting experiments using an anti-MT antibody. (E) MT induces functional signal transduction. Total lysates from VP and DLP from WT and TG mice were analyzed by immunoblotting using antibodies directed against anti-phospho-AKT (Ser473), anti-phospho-AKT (Thr308), anti-phospho-S6 (Ser240/244), anti-phospho-Shc (Tyr239/240), anti-PRAS40 (Thr246), anti-AKT, anti-S6, and antitubulin antibodies.

