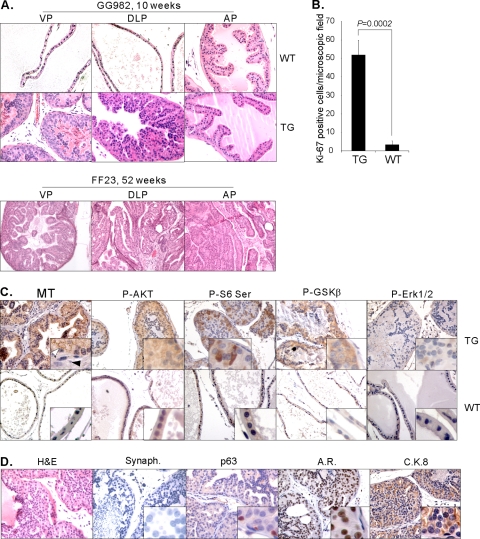
Fig. 2.
Development of adenocarcinoma upon expression of MT in the mouse prostate. (A) H&E staining displays normal prostate from a WT mouse (10 weeks old) and characteristics of mPIN in the VP and DLP of a TG mouse of the GG982 line (10 weeks old). For comparison, H&E staining on sections of an FF23 transgenic mouse prostate (52 weeks old) demonstrates the development of lesions in all prostate lobes where MT is expressed. (B) High proliferation index in the MT-induced lesions. IHC analysis was conducted with an anti-KI-67 antibody, and KI-67-positive cells were counted from five microscopic fields and averaged. The P value was calculated using the t test. Error bars show standard deviations. (C) IHC analysis was conducted with anti-MT, anti-phospho-AKT (Ser 473), anti-phospho-S6 (Ser 240/244), anti-phospho-GSKβ (Ser 9), and anti-phospho-ERK1/2 (Thr 202/Tyr 204) antibodies on DLPs of WT and TG mice (12 weeks old). Expression of MT in the transgenic mouse is detected in epithelial cells (white arrowhead) but not in stromal cells (black arrowhead). Notably, membrane-localized signals are detected. (D) Paraffin-embedded sections prepared from DLP of 10-week-old TG mice were subjected to IHC with anti-Synaptophysin (Synaph.), anti-p63, anti-androgen receptor, and anti-CK8 antibody. Images were taken at 40× magnification except for H&E staining of a sample from an FF23 transgenic mouse, which was taken at 20× magnification.

