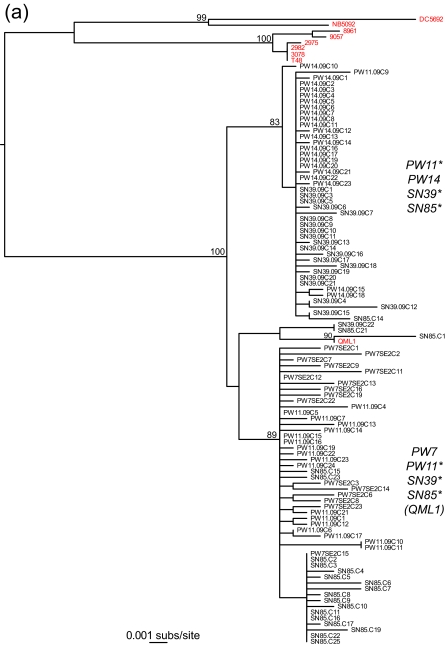
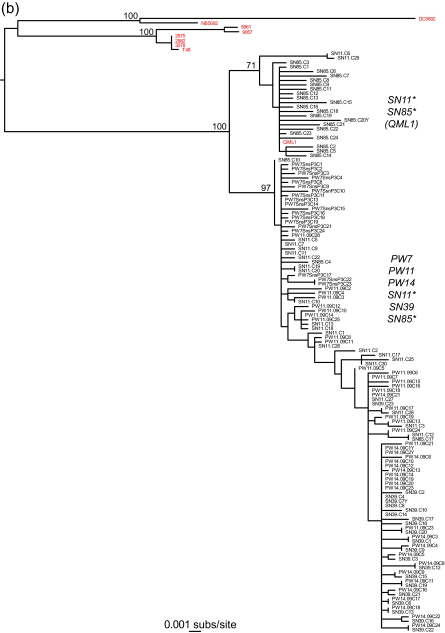
Fig. 2.
Phylogenetic relationships between E2 (a) and nsP3 (b) genes from intrahost samples of Ross River virus from patients from urban and rural settings in Australia. Note the presence of two clearly distinct lineages. RRV (consensus) sequences generated from previous studies are in red. Individuals that harbor each of the phylogenetically distinct lineages are marked with an asterisk. The phylogenetic position of strain QML1 is also indicated. Both trees are mid-point rooted for purposes of clarity only, and all horizontal branch lengths are drawn to a scale of nucleotide substitutions per site. Bootstrap support values (>70%) are shown for key nodes.


