
Fig. 5.
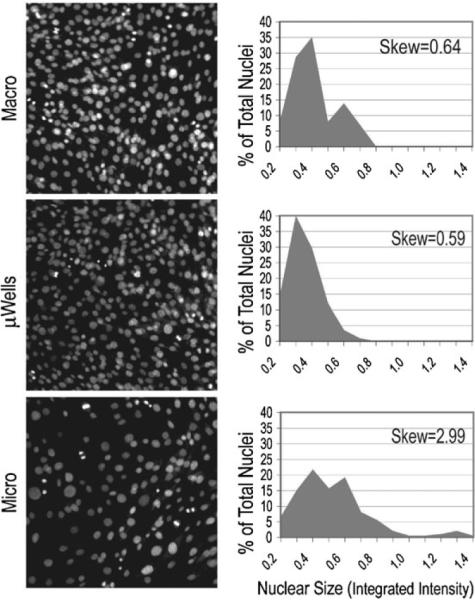
Representative images of the nuclei of macroscale cultures (top, macro), microwell cultures (middle, μwells) and microchannel cultures (bottom, micro) taken with the same exposure time and magnification. When images were analyzed by determining the integrated intensity of a sample of nuclei (minimum of 250), distributions of the nuclear size as a percentage of the total nuclei were determined, shown to the right of the images for each culture type.