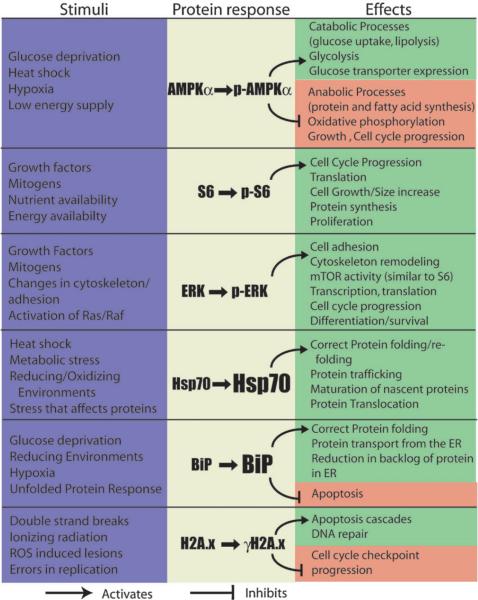
Fig. 6.
Summary of the readouts tested in microscale cultures. From left to right, columns show which stimuli result in the changes in phosphorylation or increases in expression (described in the center column) and what the subsequent activity of the protein is. Arrows indicate that the protein activates the processes listed, while blunt arrows indicate inhibition.

