
Fig. 7.
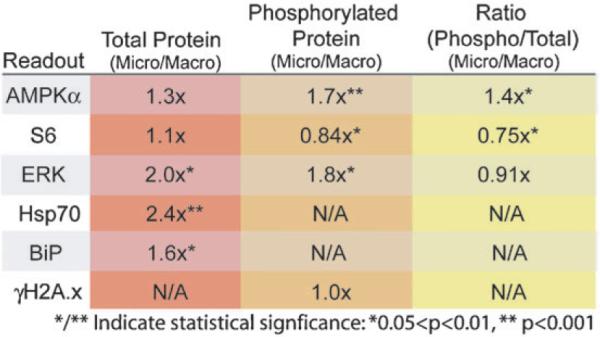
Summary of readout results comparing macro- and microscale cultures for total protein, the phosphorylated protein (if applicable) and the ratio of phosphorylated to total for each applicable readout. Several of these proteins exhibit approximately 2 fold (or more) changes in expression in only 24 h of microculture, indicating that the influences of microculture are significant and relatively rapid. Statistical significance via Student's t-test is listed when p values fell within the limits denoted.