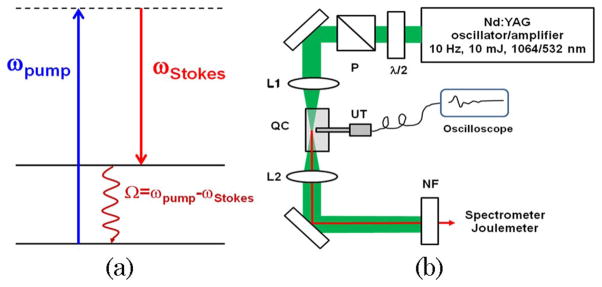
Fig. 1.
(Color online) (a) Schematic energy diagram of the stimulated Raman scattering process. (b) Schematic diagram of the experimental set up: L1, L2, lenses; P, polarizer; λ/2, half-wavelength plate; NF, Raman notch filter for 532 nm; UT, ultrasound transducer; QC, quartz cell with an active medium.

