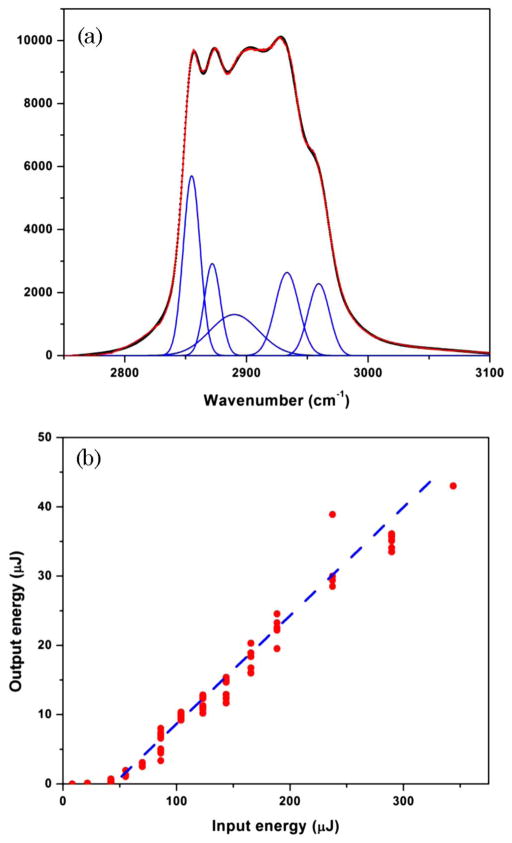
Fig. 2.
(Color online) (a) Spontaneous Raman spectrum of a mineral oil: dots, experimentally measured spectrum; red solid line, fit with five Lorentzian peaks, which are shown in blue dashed lines. (b) Experimentally measured energy of the generated Raman signal as a function of the incident energy (red circles). Dashed blue line is shown to provide a guide to the eye and indicates a threshold for the stimulated Raman scattering process at around 50 μJ.

