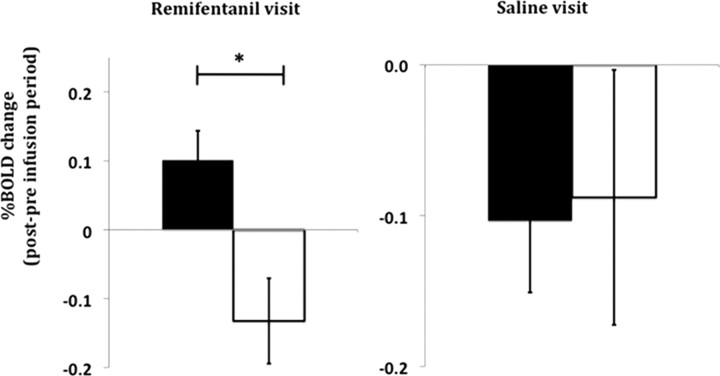
Figure 5.
The change in neuronal response of the MPRF to thermal noxious stimulation in responders (black bars) and nonresponders (open bars). The y-axes show the average change in neuronal response from the preinfusion to postinfusion period during the remifentanil (left) and the saline visits as percentage BOLD signal change (*p < 0.01).

