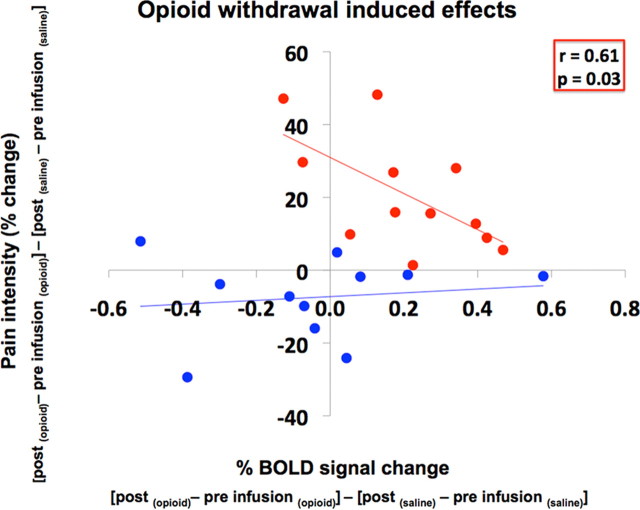
Figure 6.
Correlation of opioid withdrawal-induced effects. This graph shows the correlation of the opioid withdrawal-induced effects on MPRF activity and pain in responders (red) and nonresponders (blue). A significant negative correlation (r = 0.61; p = 0.03) is observed only in responders. The opioid withdrawal-induced effects on MPRF neuronal response (percentage BOLD signal change) and pain intensity to thermal noxious stimulation (X) were defined by (Xpostinfusion (opioid) − Xpreinfusion(opioid)) − (Xpostinfusion (saline) − Xpreinfusion(saline)).

