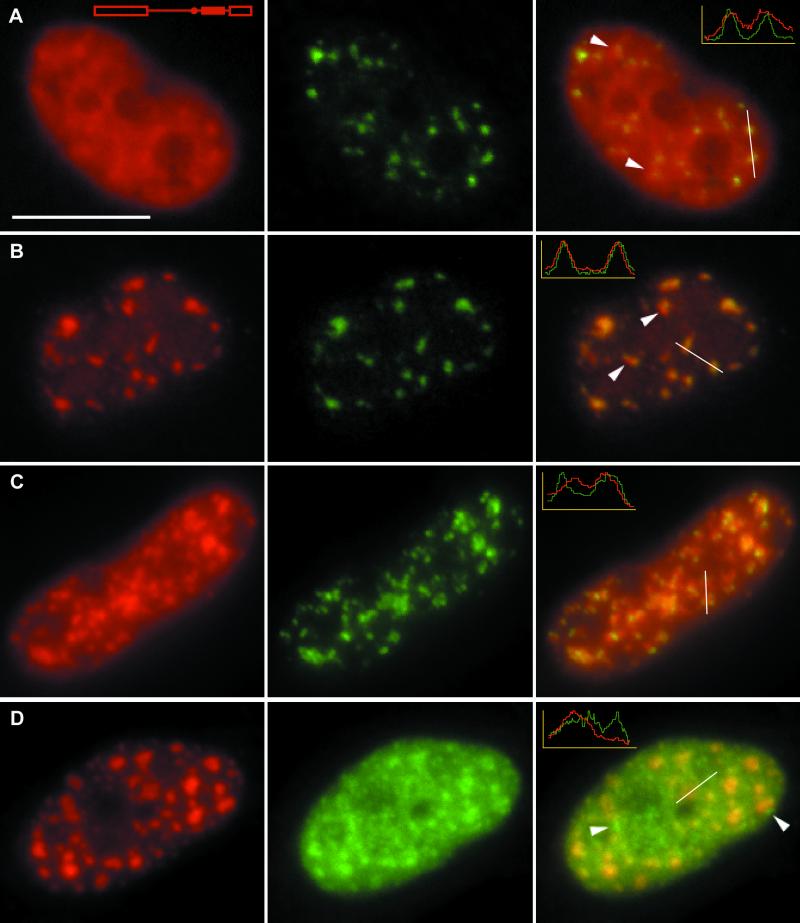
Figure 2.
HeLa cells observed after microinjection of the fluorochrome-labeled Ad1 RNAs. The two left columns correspond to individual color channels, the right column is the overlay. The structure of the Ad1 RNA is shown. The cells were labeled for SC35 protein (in green) after 5-min (A) or 15-min (B) incubation at 37°C, or after 30-min incubation at 4°C (C). Note that the Ad1 RNA (in red) accumulates in the vicinity of speckles in A (arrowheads), such an accumulation is still occasionally seen in B (arrowheads). A striking accumulation of the Ad1 RNA adjacent to the speckles is seen in C. (D) After the consecutive microinjection of the Ad1 RNA labeled with red fluorochrome (the cells being shortly incubated at 37°C) and of the Ad1 RNA labeled with green fluorochrome, the cells were incubated at 4°C for 30 min. Note the differences in red and green fluorescence patterns, the red signal being engulfed within the green signal (arrowheads). For the quantitative evaluation (inserts in Figures 2 and 3, A–E), fluorescent intensities along the segments shown in Figures 2 and 3, A—E, were scaled to the minimum and maximum values. The identical position of peaks in the two color channels testifies to the accumulation of RNAs in the speckles. The bar in Figures 2–4 and in Figure 6 designates 10 μm.

