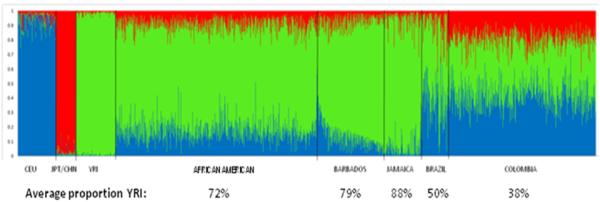
Figure 2.

Heterogeneity of African admixture in five populations. African Americans (N= 906), GRAAD Barbadians (N = 294), Jamaicans (N = 174), Brazilians (N= 119) and Colombians (N=668), relying on autosomal SNPs that qualify as ancestry informative SNP markers (AIMs; 416, 416, 79, 79 and 52 AIMs, respectively) with absolute differences >0.4 in allele frequencies between pairs of putative parental populations (Utah residents with ancestry from northern and western Europe, or ‘CEU’, indicated in blue; Asians collectively represented by Japanese in Tokyo, Japan, or ‘JPT’/Han Chinese in Beijing, China, or ‘CHB’, indicated in red; and Yoruba in Ibadan, Nigeria, or ‘YRI’, indicated in green). Color combinations (blue, red, green) for the five test populations reflect the degree of admixture of the three parental populations. The semi-parametric Bayesian algorithm implemented in STRUCTURE (v2.2; http://pritch.bsd.uchicago.edu/software) was used to infer both mean and individual West African, Northern European and Asian ancestry proportions in these five populations along with the Phase II HapMap groups.
