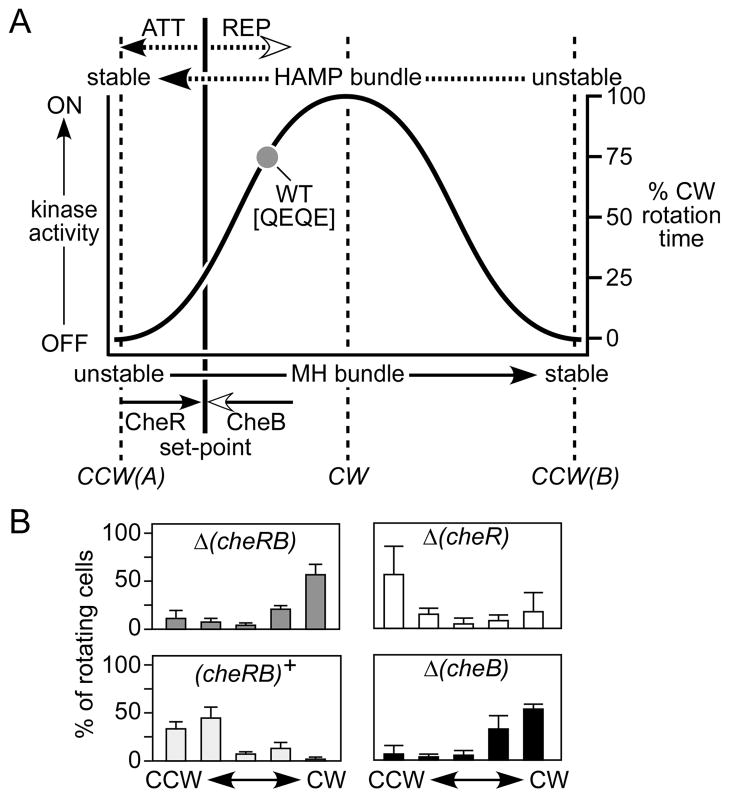
Fig. 5. Biphasic output diagram for Tsr-HAMP signaling.
(A) The diagram summarizes the proposed relationship between HAMP or MH bundle stability and kinase activity or flagellar rotation pattern. This extended dynamic bundle model proposes two kinase-off signaling states, CCW(A) and CCW(B), at opposite extremes of the HAMP bundle stability range. Receptors with intermediate stabilities activate the CheA kinase to produce CW output signals. Wild-type Tsr molecules normally operate in the high HAMP/low MH stability regime, where kinase activity increases monotonically with HAMP instability (or MH bundle stability). The precise shape of the output curve is arbitrary. Wild-type Tsr molecules in the QEQE modification state (i.e., in adaptation-deficient strains) exhibit ~75% CW output (dark gray circle), which is reduced to ~25% CW output in adaptation-proficient strains (the adaptation set-point). Filled arrowheads denote structure stabilizing influences; open arrowheads denote structure destabilizing influences. Attractant and repellent stimuli directly influence HAMP bundle stability; CheR and CheB modifications directly modulate MH bundle stability.
(B) Rotation patterns produced by Tsr wild-type molecules in various strains. The rotation data are averages and standard deviations for at least three experiments (see Table S1).

