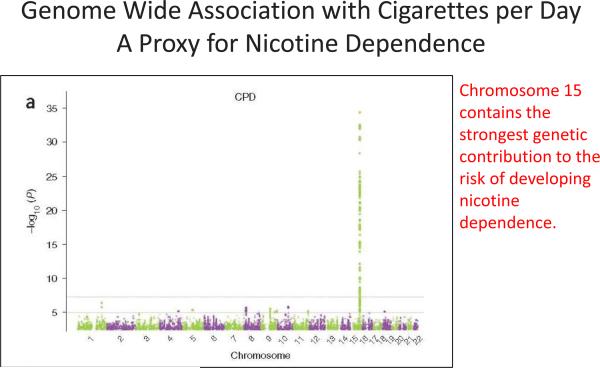
Figure 2.
Genome-Wide Association Results for cigarettes per day Manhattan plot, indicating significance of association of all SNPs in the TAG Consortium meta-analysis for cigarettes per day. Manhattan plot show SNPs plotted on the x axis according to their position on each chromosome, and plotting on the y axis (shown as negative log10 P value). Chromosome 15 contains the strongest genetic contribution to the risk of developing nicotine dependence. Figure courtesy of TAG Consortium (2010).

