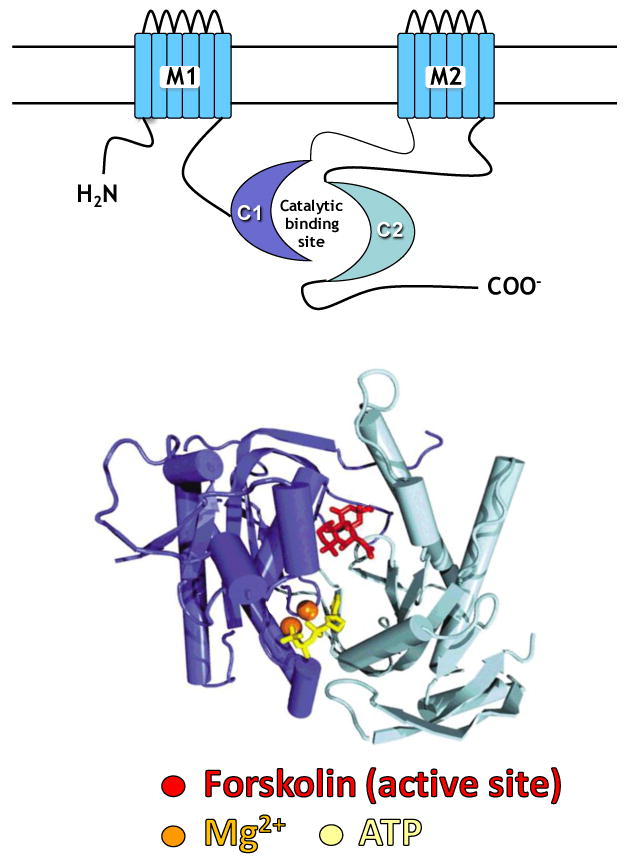
Figure 1.

The diagram (top) shows the features of adenylyl cyclase, including the two transmembrane regions (M1 and M2), which anchor the protein to the cell membrane, and the cytoplasmic regions (C1 and C2), which form the catalytic core. Below is a representation of the C1 and C2 domains, derived from X-ray crystallography [16], displaying the structural relationships of the catalytic core. Darker blue represents the C1 region, lighter blue, the C2 region. At the interface between C1 and C2 reside binding sites for forskolinMg2+ and ATP [16].
