Figure 2.

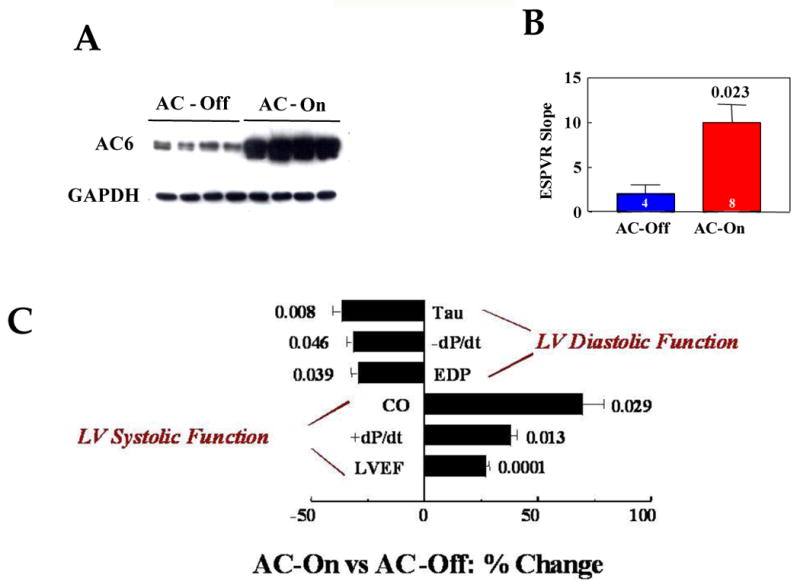
A. LV AC6 expression. The Western blot shows marked increase (p<0.0001) in AC6 protein in LV samples from mice 5 weeks after activation of AC6 transgene expression (n=8 for both groups).
B. Effect of AC6 Transgene Expression on LV Contractility. The end-systolic pressure-volume relationship (ESPVR) was measured using conductance catheters and high fidelity pressure transducers in intact anesthetized mice 5 weeks after activation of AC6 expression in animals with severe heart failure. Increased cardiac AC6 expression was associated with substantial increases in LV contractility as reflected in increased slope of the ESPVR. The graph summarizes data from all animals (AC-Off, Blue bar; AC-On, Red bar); bars represent mean values, error bars denote 1 SEM. Number above bar denotes p value comparing the two group means by Student's t-test (two tails); number in each bar denotes number of animals studied in each group.
C. Effect of AC6 Transgene Expression on LV Function. Measures of LV diastolic and systolic function were made 5 weeks after activation of AC6 expression in mice with infarct-induced CHF. The percent change in each measurement between groups is shown. Activation of cardiac AC6 expression was associated with substantial increases in measures of both systolic and diastolic function. Numbers adjacent to bars denote p values from Student's t-test (two-tails). AC-On (n=12), AC-Off (n=9). Tau, time constant of relaxation; -dP/dt, maximal rate of decline in LV pressure; EDP, end-diastolic pressure; CO, cardiac output; +dP/dt, maximal rate of rise in LV pressure; LVEF, left ventricular ejection fraction.
