
Figure 2. LV ACVI Content.
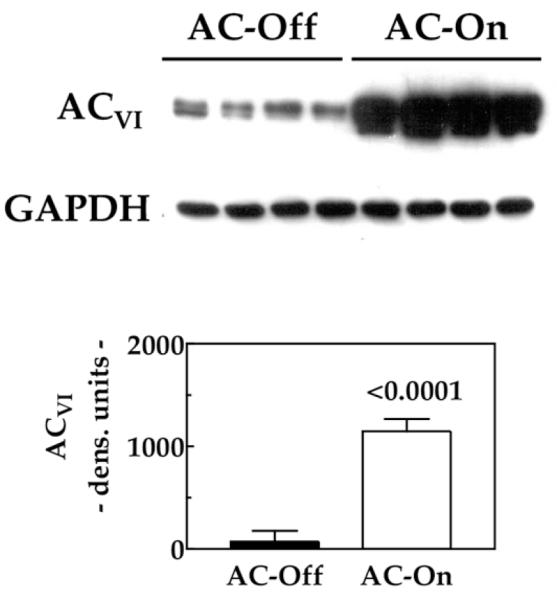
The Western blot shows a marked increase in ACVI protein in LV samples from mice 5 weeks after activation of ACVI transgene expression (n = 8 for both groups). The graph summarizes data from Western blotting. Bars = mean values; error bars = 1 SE; number above bars = probability value (Student unpaired t test, 2-tailed). ACVI = adenylyl cyclase VI; LV= left ventricular.