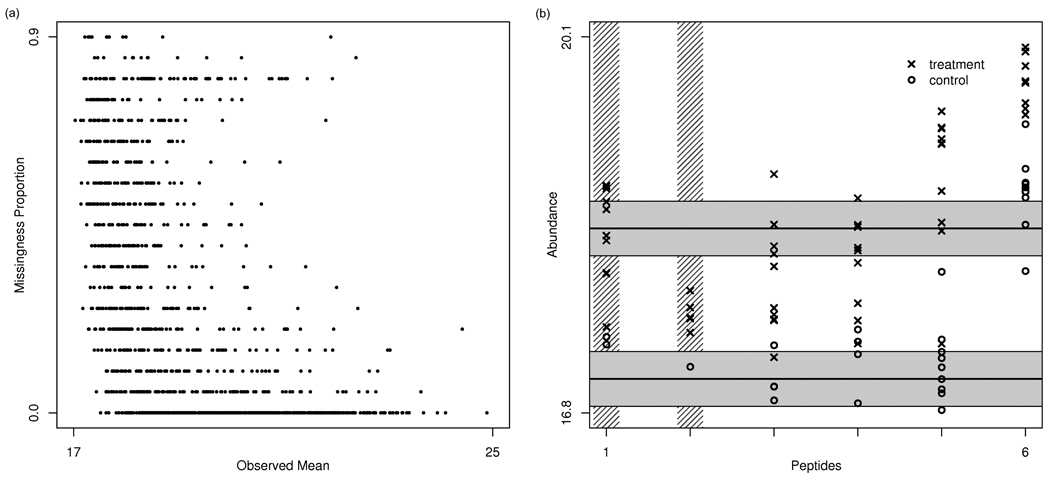
Figure 6.
Protein quantitation. The left panel shows the proportion of missing values in an example dataset as a function of the mean of the observed intensities for each peptide. There is a strong inverse relationship between these, suggesting that many missing intensities have been censored. The right panel shows an example protein found to be differentially expressed in a two-class human study. The protein had 6 peptides that were identified, although two were filtered out due to too many missing values (peptides 1 and 2, as indicated by the vertical shaded lines). Estimated protein abundances and confidence intervals are constructed from the peptide-level intensities by a censored likelihood model (Karpievitch et al (2009a)).

