
Fig. 2.
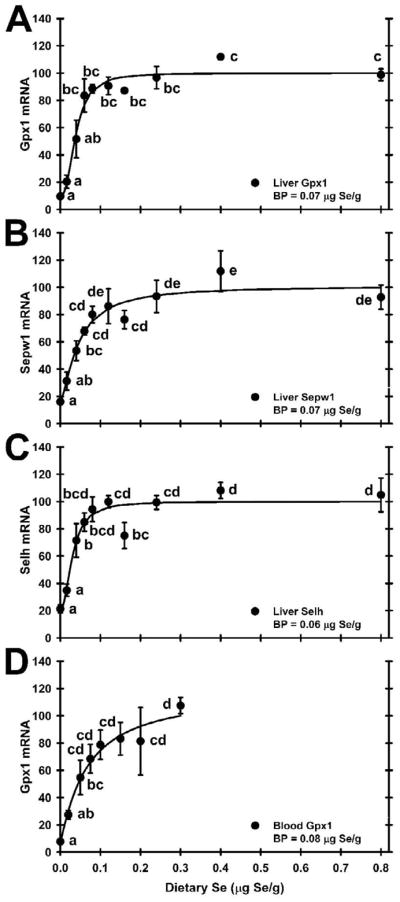
Relative levels of selenoprotein mRNA for liver Gpx1 (A), liver Sepw1 (B), liver Selh (C), and whole blood Gpx1 (D) in male weanling rats fed diets containing the indicated levels of Se for 28 days, as determined by qRT-PCR on total RNA isolated from rat liver (A–C, n=3/diet, as described in [29]), and as determined by ribonuclease protection analysis on total RNA isolated from rat blood (D, n=4/diet, as described in [31]). Values are means ± SEM. Data in each panel is significant (P < 0.0001) by ANOVA; values with a common letter are not significantly different (P < 0.05). The calculated plateau breakpoint (BP) for each response curve is also indicated.