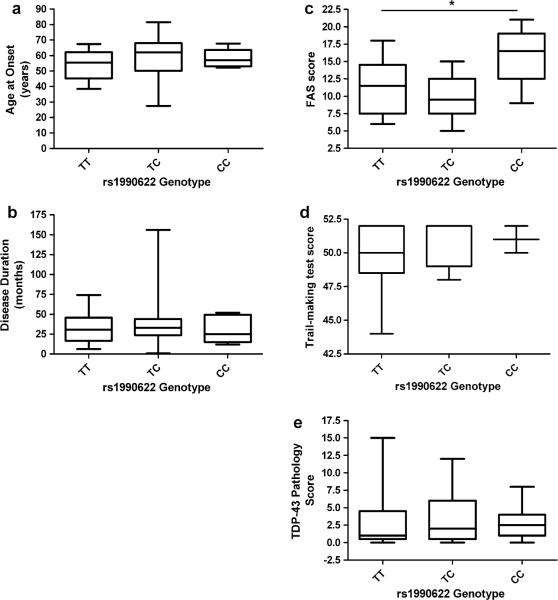
Fig. 1.
Box and whiskers plots comparing a age at onset, b disease duration, c FAS score, d Trail-making test score, and e TDP-43 pathology score, among TMEM106B genotypes. While FAS score (p = 0.029) is significantly associated with genotype, the extent of TDP-43 pathology (p = 0.788) is not. Box indicates interquartile range, with median indicated by line; whiskers denote full range

