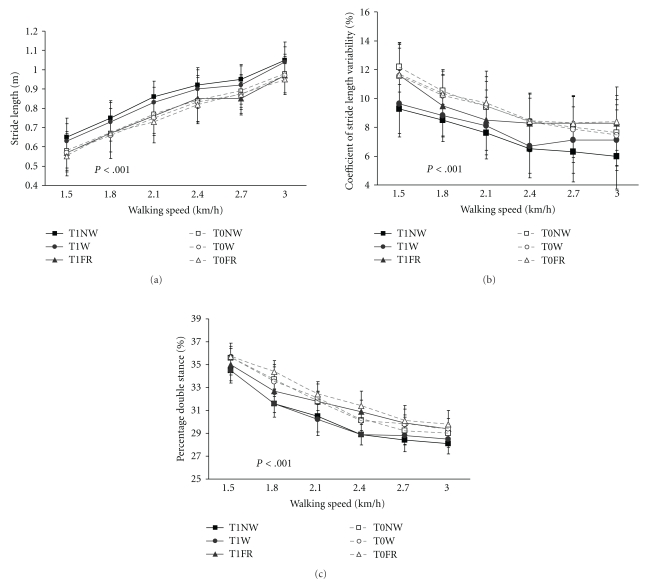
Figure 5.
(a) Stride length increased significantly with increasing walking speed, and improved further on the second assessment (P < .001). Stride length improved significantly more in the Nordic walking and walking groups than in the flexibility and relaxation group (P < .001). T0 = first assessment; T1 = second assessment, error bars indicate the standard deviation. (b) Stride length variability improved most in the Nordic walking group. Nordic walking training was superior to walking (P < .01) and the flexibility and relaxation programme (F&R) (P < .001). T0 = first assessment; T1 = second assessment, error bars indicate the standard deviation. (c) The duration of the double stance phase decreased with increasing walking speed in all groups but significantly more in the Nordic walking and walking group (P < .001); T0 = first assessment, T1 = second assessment, error bars indicate the standard deviation.

