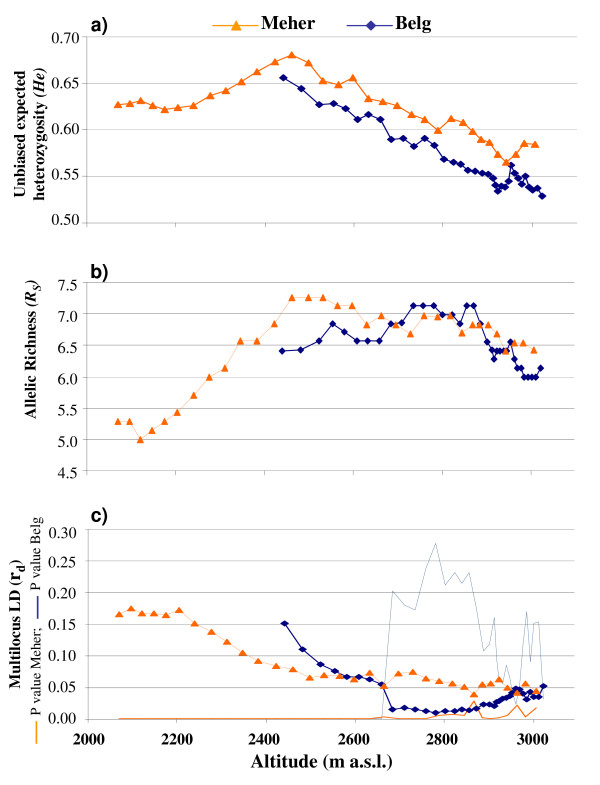
Figure 8.
'Sliding-window' analysis for the two seasons: Belg (blue) and Meher (orange). a) Genetic diversity (He); b) allelic richness (RS); c) multilocus linkage disequilibrium (LD) along the altitudinal cline, with P values also shown. The altitude of each window (20 populations, 40 individuals) was determined by averaging the altitude of the populations (farmers' fields); hence, the differences in the average altitudes between the windows are not constant.

