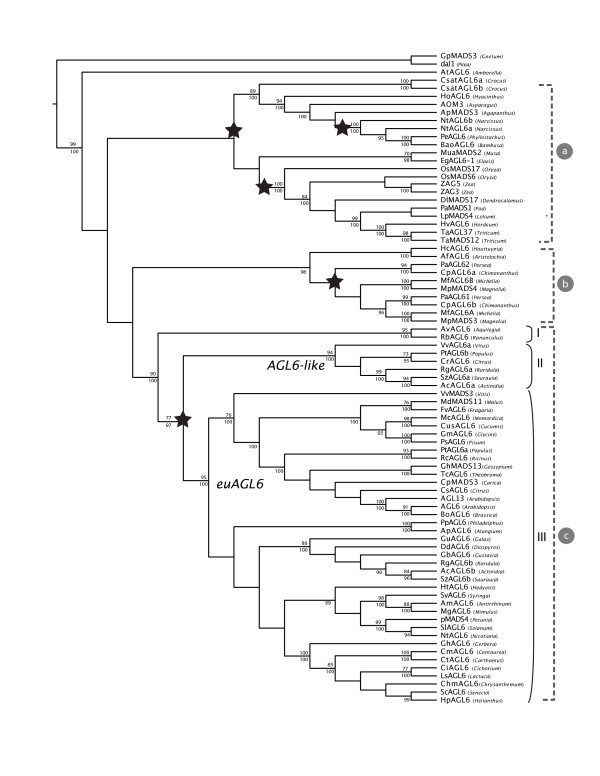
Figure 1.
Phylogeny of AGL6 genes in angiosperms, as inferred from maximum likelihood and Bayesian analysis. Bayesian posterior probabilities (below) and bootstrap values from the likelihood analysis (above) are plotted on the tree. Black star indicates inferred duplication events. Included species, abbreviations and accession numbers are listed in additional file 2: List of species used in the phylogenetic analysis

