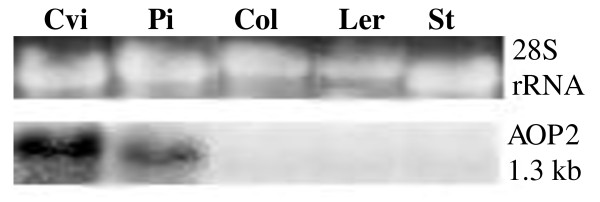
Figure 2.
Northern blot analysis of leaf AOP2 expression in five Arabidopsis accessions. The level of AOP2 transcript (1.3 kb) in Cvi, Pi, Col, Ler and St is shown. 28S rRNA is displayed in the top panel to show RNA loading levels in each lane. RNA was extracted from leaf tissue from five plants grown in continuous light.

