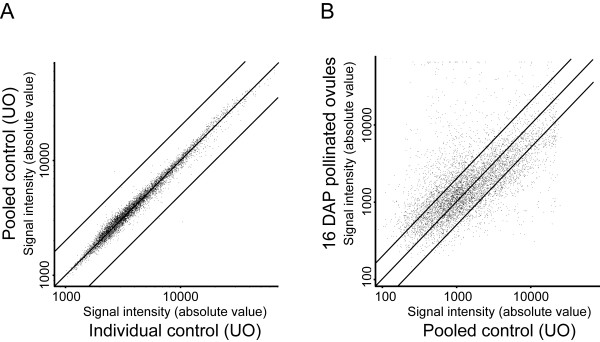
Figure 1.
Gene expression profiling of unfertilized and fertilized ovule samples. Scatter plots comparing the average fluorescence intensities in microarray experiments measuring the change in transcript abundance between A, pooled control and individual control; or B, 16 DAP pollinated ovules versus unfertilized ovules. The individual control samples were different from the pooled one that is used as the universal control in all our experiments. Black transversal lines show the ±2 fold change.

