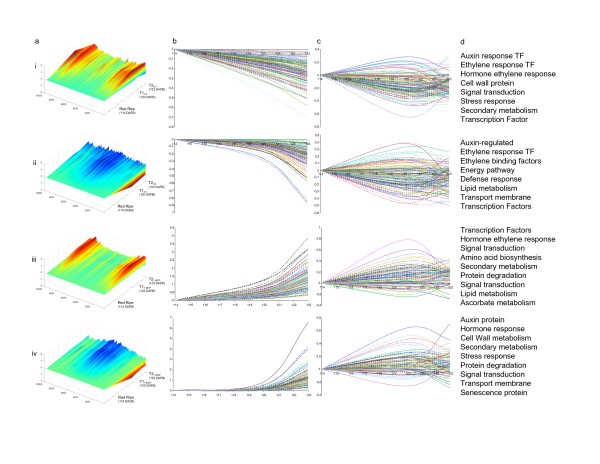
Figure 2.
The effect of 1-MCP on heterologous (HET) transcriptome dynamics during the final stages of apple ripening. Panel (a) 3D rendering of gene expression between 114 DAFB (red ripe) and 123 DAFB (T2 stage). Red indicates gene expression that is up-regulated; blue indicates gene expression that is down-regulated. Control samples (i and ii) and samples treated with 1-MCP (iii and iv) are shown. The X axis represents unique TOM1 features, the Y axis represents relative expression level after log2 transformation, and the Z axis represents time in DAFB. Panel (b) shows four distinct expression profiles identified for the final stages of apple ripening (114 DAFB to 123 DAFB). The X axis represents time (114 DAFB to 123 DAFB) and the Y axis represents relative expression level after log2 transformation. Panel (c) shows the effect of 1-MCP on the expression of genes shown in panel (b). Panel (d) lists the annotation categories for genes shown in (b) and (c). Abbreviations: DAFB, days after full bloom; TF, transcription factor.

