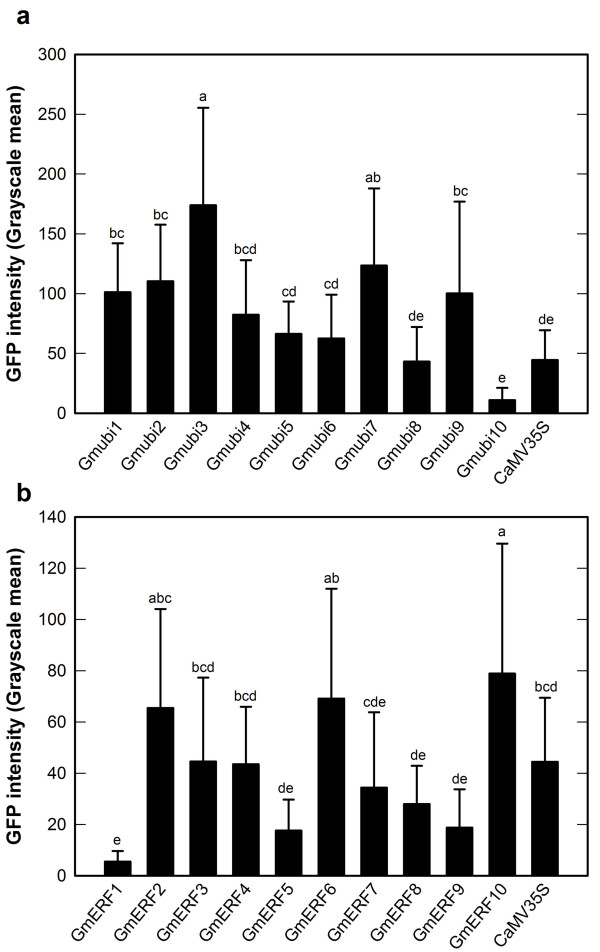
Figure 5.
Analysis of GFP intensity in hairy roots induced with A. rhizogenes harboring different promoter constructs. (a) Gmubi promoters. (b) GmERF promoters. GFP intensity is presented as grayscale values. Values are means ± SD. Letters on top of each column were generated by the Tukey's Studentized Range (HSD) test. Columns followed by the same letter are not statistically different at P > 0.05.

