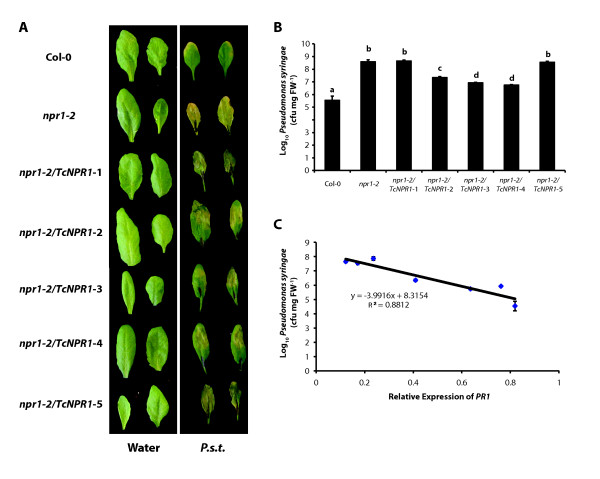
Figure 4.
Pseudomonas syringae infection assay of transgenic Arabidopsis npr1-2 mutant lines. A. Disease symptoms on leaves of Col-0, npr1-2 and five independent lines of npr1-2 plants transformed with TcNPR1 (npr1-2/TcNPR1) inoculated with Pseudomonas syringae pv. tomato DC3000 (P.s.t.) (OD600 = 0.002) at three days post inoculation and on leaves of the same seven genotypes infiltrated with water as a control treatment. B. Growth of P.s.t. in leaves from Col-0, npr1-2 and five individual transgenic lines (npr1-2/TcNPR1). Three days after inoculation, leaf disks were collected and bacterial titers were measured. Data represents the means ± standard errors of three biological replicates, each containing three leaf disks from three individual plants. Letters above the histogram indicate statistically significant differences among genotypes (P < 0.01) using the single factor ANOVA. C. Correlation of bacterial growth with relative AtPR1 expression level. Average growth of Pseudomonas syringae pv. tomato DC3000 (Figure 4B) and average AtPR1 gene expression (Figure 3) were evaluated in leaf tissue of Col-0, npr1-2 mutant and five transgenic lines expressing TcNPR1. Data was plotted and analyzed by liner regression analysis.

