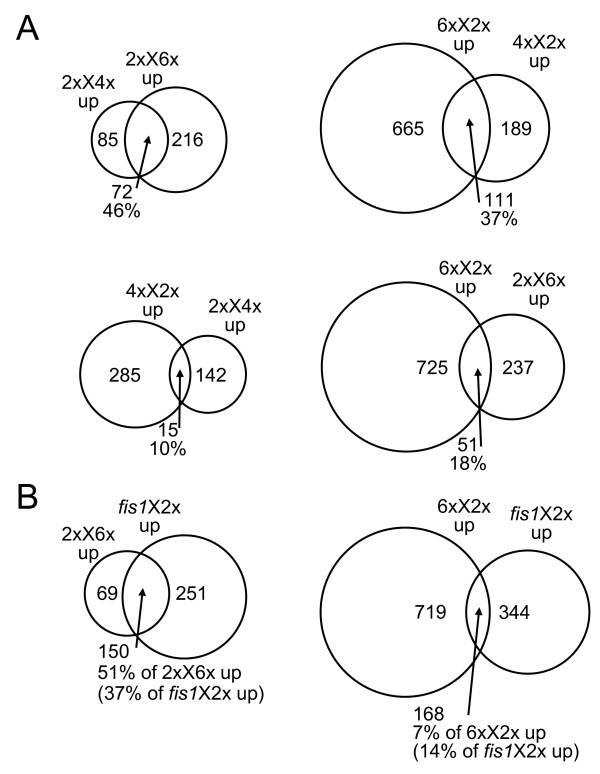
Figure 2.
Extent of agreement between sets of genes called up. The percentage shown in the region of overlap is the percentage of the maximum possible agreement for each pair. (A) Agreement between interploidy crosses generating paternal and maternal excess. (B) Agreement between fis1X2x and the two extreme interploidy crosses.

