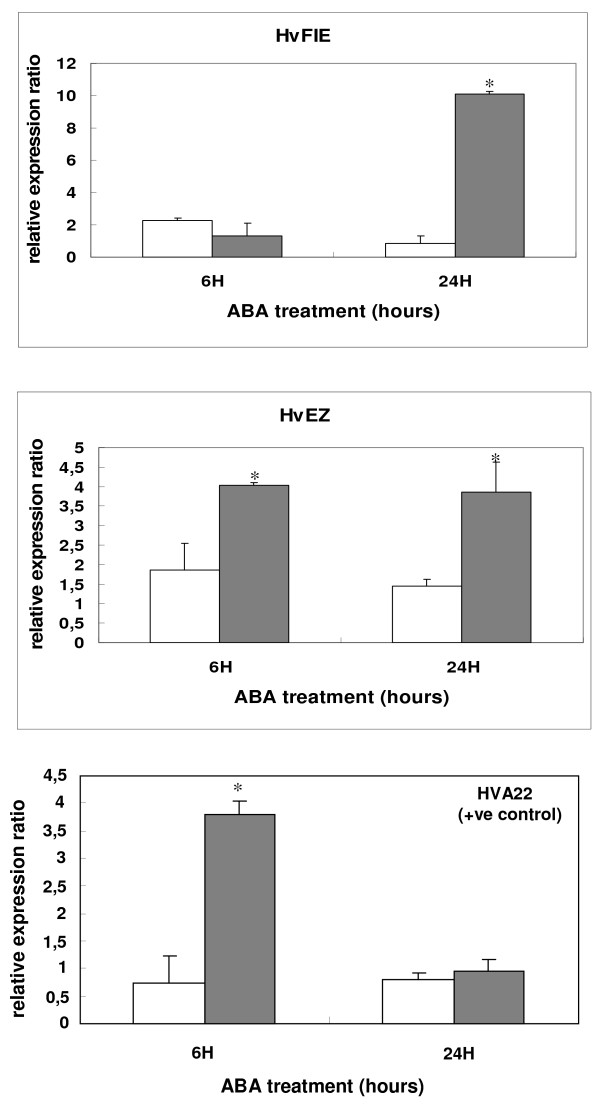
Figure 7.
Expression analysis of barley PcG genes after treatment of seedlings with ABA. Quantitative real-time PCR analysis of HvFIE and HvE(Z) genes at 6 and 24 h after treatment of Caresse seedlings with 100 μM ABA. Expression values were normalized to those of HvActin. Data represent mean values from two independent experiments with standard deviations. Relative expression ratio of each sample was compared to the control group which was untreated plants, 0 h, and was assigned the value of 1. Grey bars, hormone-treated plants for 6 h and 24 h; white bars, no hormone treated plants (mocked with H2O/Tween for 6 h and 24 h, respectively). Values significantly different (P < 0.05) from the control group are marked with an asterisk. The barley gene HVA22 (known to be induced by ABA) was used as positive control.

