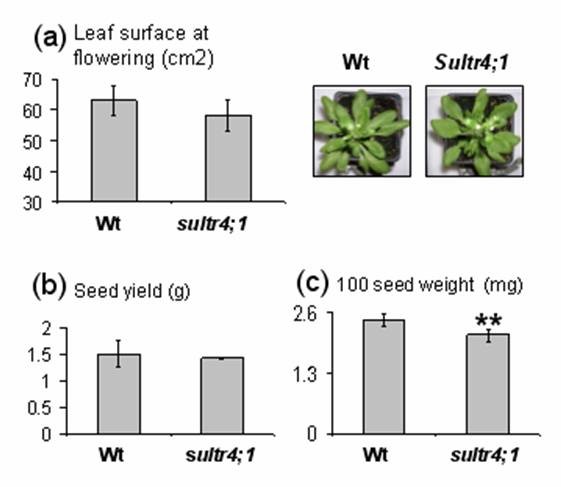
Figure 3.

Projected rosette leaf surface at flowering a), seed yield b), and seed weight c) of wild-type and sultr4;1 mutant plants. Each bar represents the mean ± SE of at least three biological replicates. The data were submitted to variance analysis. * and ** indicate p < 0.05 and p < 0.01, respectively.
