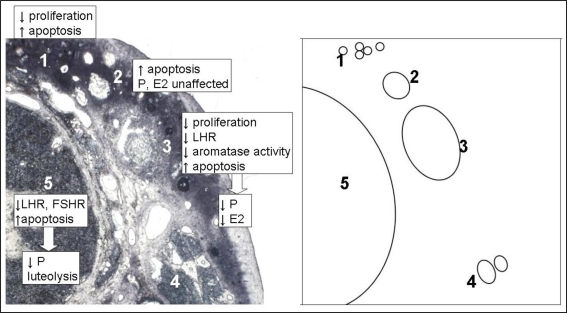
Figure 1.
Theoretical construct of local gonadotropin-releasing hormone (GnRH) action on follicular development in the mammalian ovary, based on experimental evidence. GnRH and GnRH receptor (GnRH-R) are expressed on granulosa cells at all stages of follicular development and on granulosa-luteal cells of corpora lutea. Prehierarchical follicles (1) are not stimulated by Follicle stimulating hormone (FSH) and gonadal GnRH reduces granulosa cell numbers by reducing proliferation and increasing apoptosis in these follicles (Takekida et al., 2003). As follicles gain the ability to respond to FSH, they overcome this inhibition and grow into small/medium hierarchical follicles (2). GnRH increases apoptosis of granulosa cells in these follicles, but this does not cause a significant reduction in the secretion of already low levels of estradiol (E2) and progesterone (P) (Takekida et al., 2003). FSH, P and E2 enhance the growth of these follicles into large hierarchical follicles(3). GnRH reduces granulosa cell proliferation, aromatase activity (Gore-Langton et al., 1981) and luteinizing hormone receptor (LH-R) expression (Hsueh et al., 1980) while continuing to increase granulosa cell apoptosis (Takekida et al., 2003). All of these factors contribute to a significant decrease in the secretion of E2 and P from these follicles (Hsueh et al., 1980; Takekida et al., 2003). The reduction in LH-R also makes the follicle less able to respond to the LH surge with ovulation. If large hierarchical follicles are not able to overcome this inhibition, their growth will cease and they would become atretic(4). If a large hierarchical follicle does overcome inhibition by GnRH it can become the corpus luteum (5) post-ovulation. GnRH decreases LH-R and FSH-R expression in, reduces secretion of progesterone from and increases apoptosis of granulosa-luteal cells (Kang et al., 2000, 2001; Zhao et al., 2000). The highest expression of GnRH and GnRH-R occurs at the end of the luteal phase (Chakrabarti et al., 2008), indicating GnRH may be a contributing factor to luteolysis. The diagram on the right is a representation of the photomicrograph on left, showing the relative location of each follicular stage for clarity.

