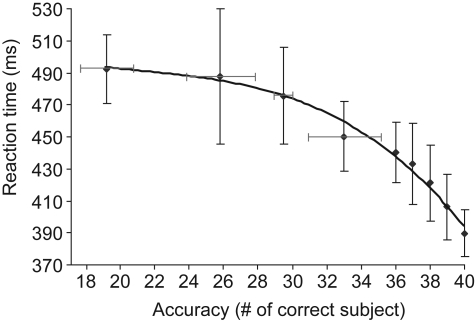
Figure 1.
Global accuracy score plotted as a function of mean reaction time on target images. For each target image, we determined the mean reaction time (averaged over 40 subjects) and the accuracy in terms of the number of subjects that categorized the image correctly. More than half of the target-images (112 out of 200) were correctly categorized by all 40 subjects. Failure of a large number of subjects was only observed for a few target images. Vertical bars represent the standard deviation of reaction time on correctly categorized images. For lower accuracy levels (<35 subjects correct out of 40), reaction times were averaged for image clusters of approximately the same size. Four clusters were considered at accuracy levels corresponding to 19, 26, 29, and 33 (number of correct subjects out of 40 subjects), the horizontal bars representing the standard deviation in terms of subjects correct for these clusters. The correlation between accuracy and RT fits to an exponentially decreasing curve as shown above (linear correlation in appropriate log-space R2 = 0.96; p < 2.10−7). For accuracy levels above or equal to 36/40, the relation between accuracy and RT is also close to linear (R2 = 0.98; p = 0.0014).

