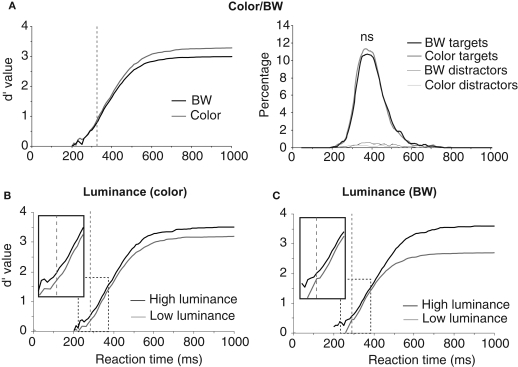
Figure 2.
Influence of image luminance and color on performance. (A) Performance on color and BW images. On the right, the reaction-time distributions (plotted as percentage of responses) for target and distractor trials in color or in BW show a small effect around median reaction time. On the left, the dynamic d′ curve indicates that differences in accuracy are observed from 325 ms (vertical dashed line) with color image being more accurately categorized than BW ones (χ2 test at p < 0.05 reaching at least p < 0.001 in the subsequent time bins; see Materials and Methods). However there is no difference in accuracy between BW and color images for the fastest responses. (B) Effect of global image luminance on performance for color photographs reaching significance at 281 ms. C. Effect of global image luminance on performance for BW photographs reaching significance at 292 ms. (B) and (C) The dynamic d′ curves computed for low luminance images are shifted towards longer latencies (see enlargement of dashed rectangle). The vertical dashed line shows the latency at which the accuracy difference becomes significant.

