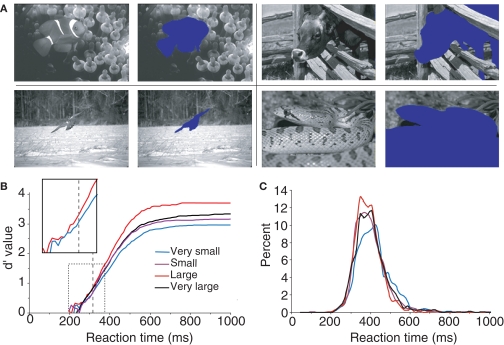
Figure 3.
Influence of the relative surface occupied by the animal in target pictures. Only target pictures containing one animal are considered here. (A) Four examples of animals semi-automatically cut out of target pictures to calculate their surface in the picture (one for each size class “very small”, “small”, “large” and “very large”). (B) Dynamic d′ plots (see Materials and Methods) showing how subject accuracy varied over time for the four groups of images containing animals of increasing sizes). The vertical dashed line at 318 ms indicates the latency at which there is a significant difference in accuracy between the “very small” and the “large” animal groups (χ2 test; same as in Figure 2). The box shows a close-up view of the dashed rectangle only for the d′ curves computed for “very small” and “large” targets in order to better illustrate the shift towards longer latencies observed with very small targets. (C) Histogram of reaction time (20-ms time bins) for the four sets of stimuli.

