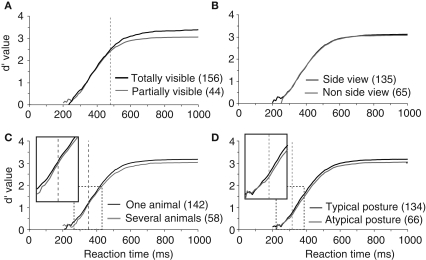
Figure 4.
Influence of animal target configuration on subjects performances illustrated with d′ curves. (A) Analysis of performance depending on whether the animal was totally or only partially visible. (B) Influence of the viewpoint of the animal (side-view versus non side-view). (C) Influence of the number of animals in the target image (“one” versus “several”). (D) Influence of the animal posture typical versus atypical. For A–D, as in previous figures, vertical doted lines represent the earliest latency at which a statistically significant effect was seen on accuracy (479 ms for visibility; 353 ms for the number of animal; 316 ms for the animal posture). Numbers in brackets indicate the number of stimuli considered in each class. Boxes show close-up views of the d′ curves within the dashed rectangles.

