
Figure 8.
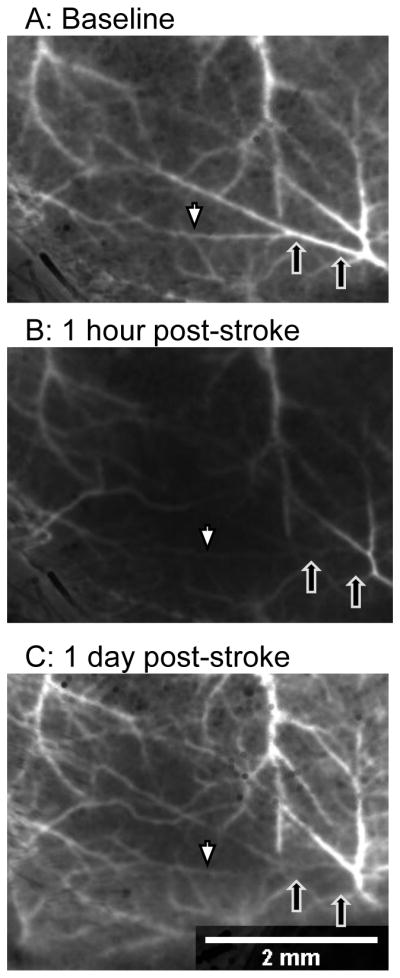
Retrograde flow after laser occlusion in a C57BL/6J mouse. (A) Baseline image before occlusion; black arrows indicate the extent of the clot after laser occlusion. (B) Shortly after occlusion, the laser speckle signal decreases within the targeted artery distal to the site of occlusion (white arrow is distal, black arrows indicate site of occlusion). (C) At 24 hours, retrograde perfusion of the distal artery branches has increased (white arrow); however, the clot persisted as a dark signal in the laser speckle image and by direct visualization (black arrows).