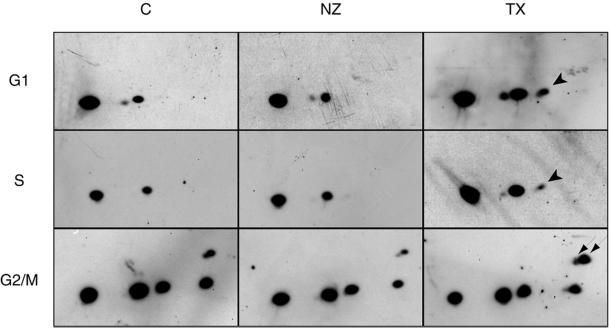
Figure 7.
MT-dependent phosphorylation of stathmin/Op18 in somatic cells. Two-dimensional gel analysis of proteins from HeLa cells synchronised in G1, S, and G2/M phases were performed in control cells (C), or after 2 h treatment with paclitaxel (TX) or nocodazole (NZ). Proteins were further analyzed for stathmin/Op18 by immunoblotting with antiserum I. Large arrowheads point to an apparently more abundant hyperphosphorylated form in TX-treated G1 and S cells. Small arrows point to more abundant tri- and tetraphosphorylated isoforms in TX-treated G2/M cells.

