Figure 4.
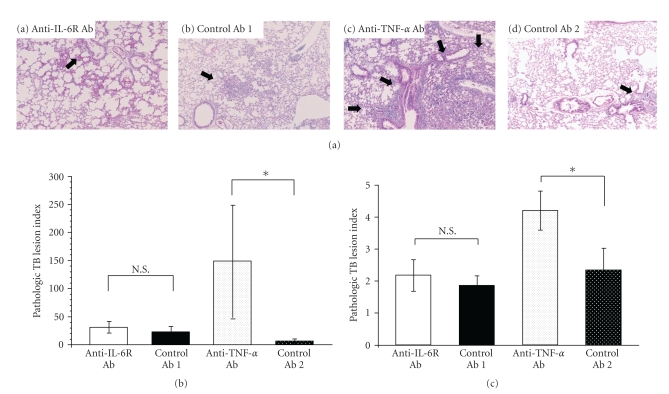
Histopathological analysis of mice 4 weeks after TB challenge. (a) Representative photomicrographs of lung tissues sections harvested from mice administered (a) anti-IL-6R Ab, (b) control Ab 1 (IL-6R), (c) anti-TNF-α Ab, or (d) control Ab 2 (TNF-α). Arrows indicate TB lesions including poorly defined granuloma-like lesions (×40, hematoxylin-eosin stain). (b) Pathologic TB lesion index in lungs. Results are the mean ± S.E.M. of triplicate samples from 5 mice per group. *P < .05 by Student's t-test. N.S.: Not significant by Student's t-test. (c) Pathologic TB lesion index in liver. Results are the mean ± S.E.M. of triplicate samples from 5 mice per group. *P < .05 by Student's t-test. N.S.: Not significant by Student's t-test.

