Figure 2.
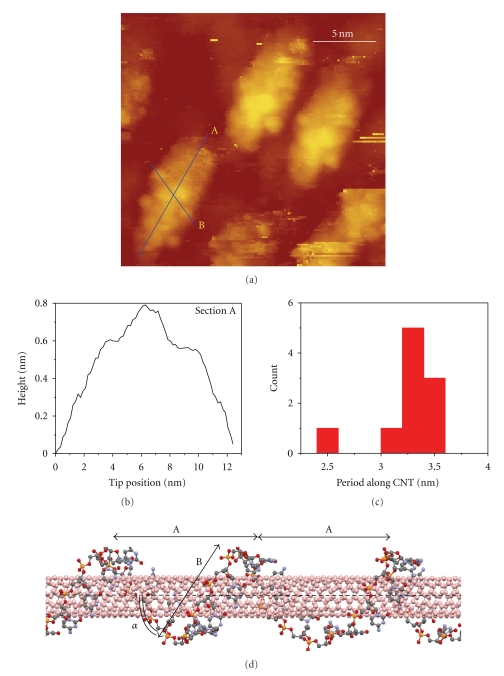
STM data and theoretical interpretation: (a) 21 × 21 nm STM topographic image of CNT-DNA hybrids on Si(110) substrate acquired at I t = 10 pA and U b = 3 V at 50 K; (b) height profile along Section A; (c) statistical distribution of characteristic lengths of periodic modulations extracted from height profiles along the Section A. (d) Optimized structures of (6,5) tube wrapped in GAGAAGAGAGCAGAAGGAGA-oligomer. For the simulated geometry, the average period of DNA helices along the tube is A = 3.0–3.3 nm and the wrapping angle is α ~ 63°, which are in good agreement with an STM experiment.

